Every answer starts with the conclusion, then shows the evidence and the next step. Each number comes from a tool call you can open.
Tool calls#
Above the text, Used N tools lists the calls Henkan made. Select it to expand the list.
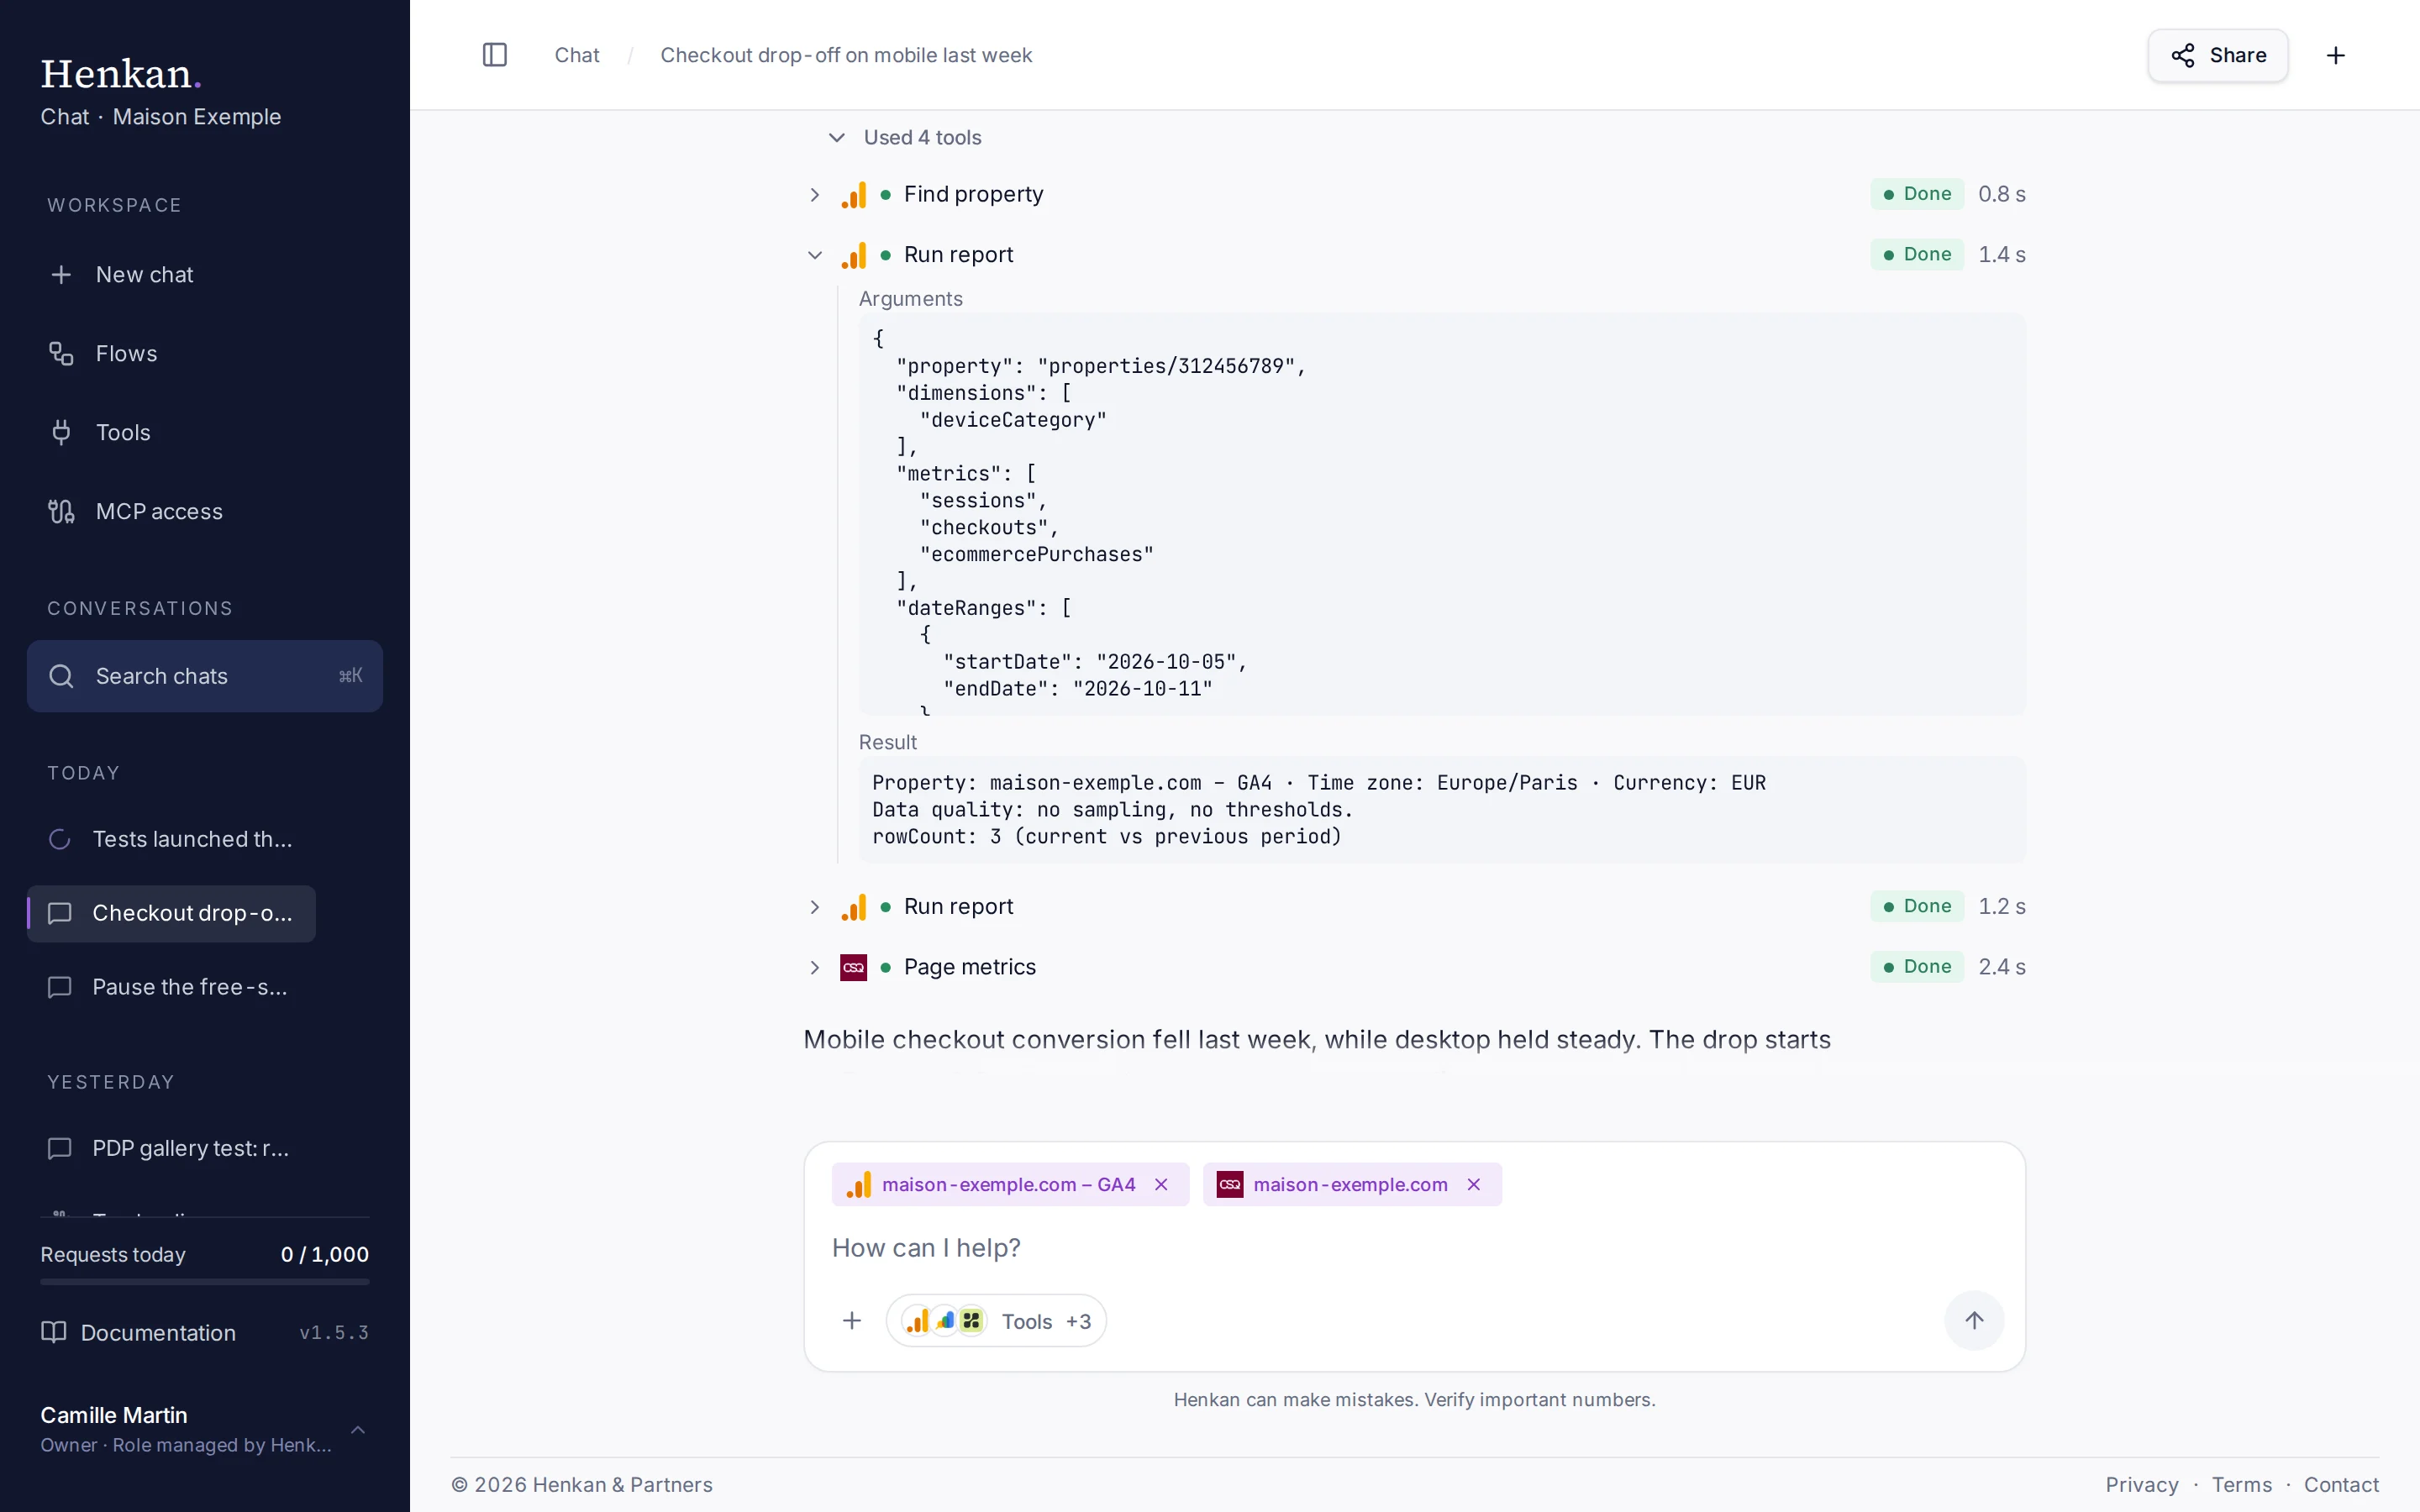
| Status | Meaning |
|---|---|
| Running | The call is in progress. |
| Done | The call succeeded. Its result was used for the answer. |
| Error | The tool returned an error. Henkan says so instead of inventing data. |
| Approval needed | The call changes data and waits for your decision. See Approve actions. |
| Denied | You denied the call, or it was cancelled because you sent a new message. |
Select a row to see its Arguments and Result. When a Google Analytics result reports quota usage, the row shows how much of the hourly quota is left.
Tables#
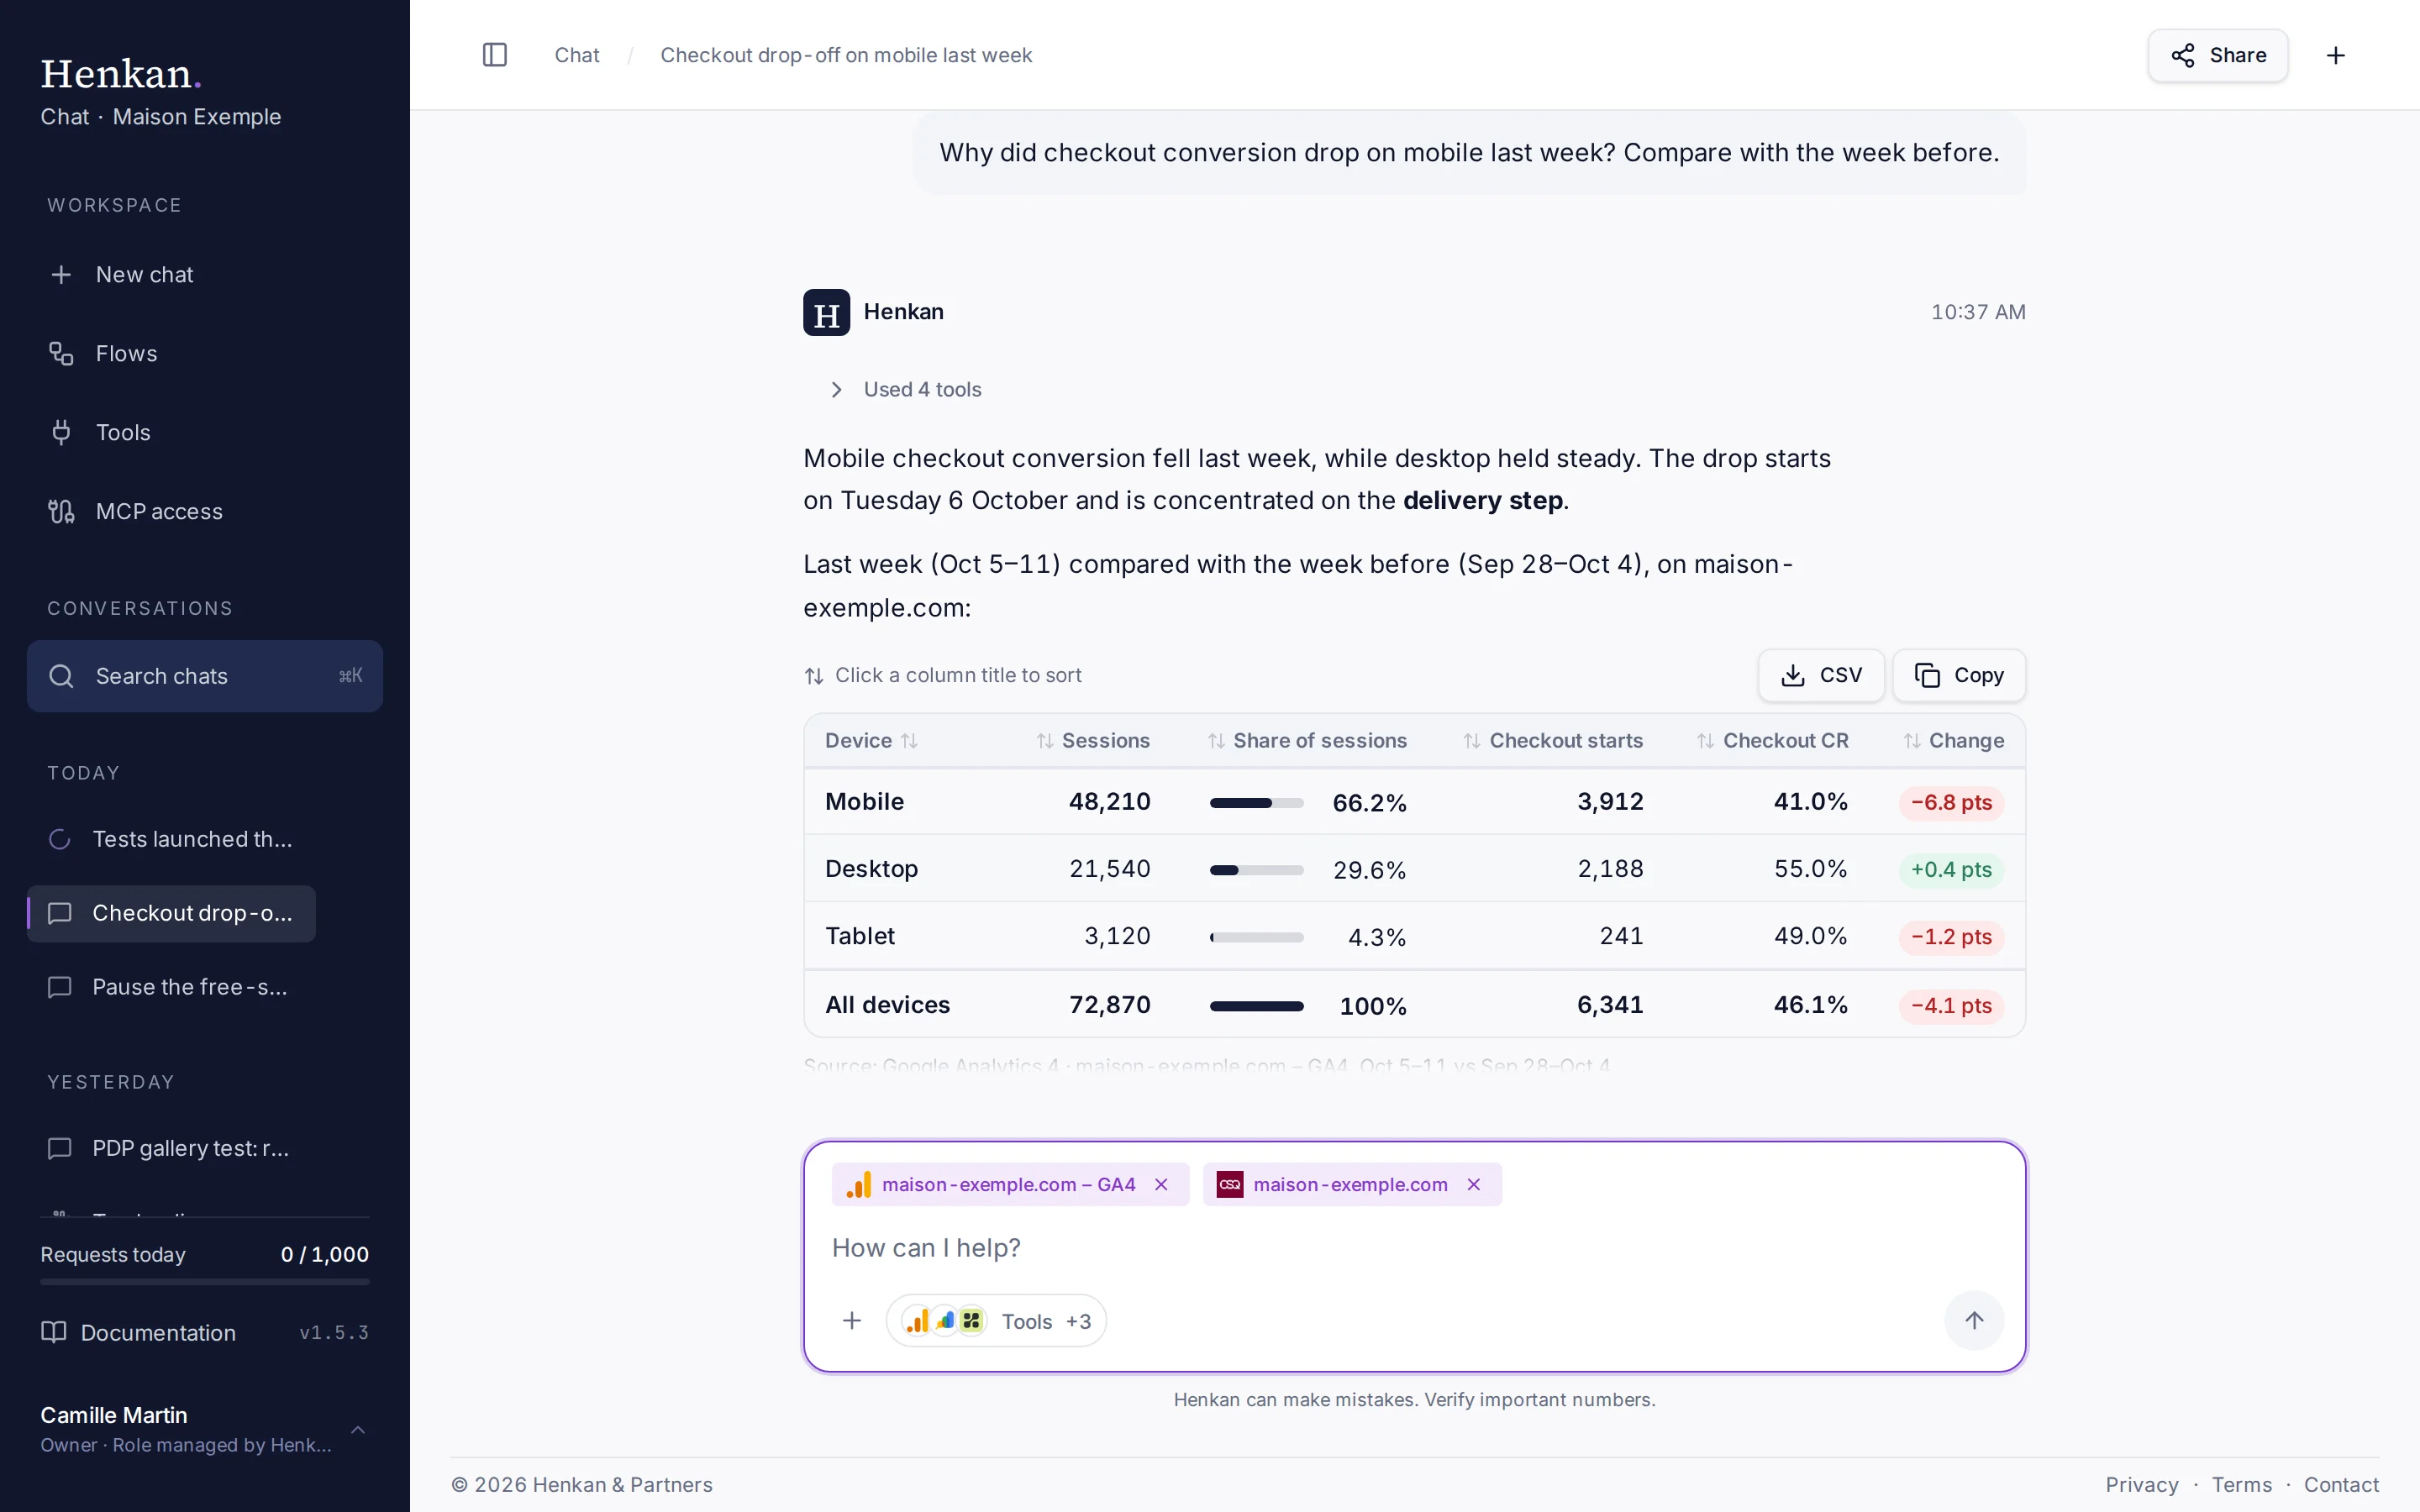
Tables have compact headers and right-aligned numbers whose digits line up. The key row and the total row (a first cell such as Total or All devices) are in bold.
| Feature | What it does |
|---|---|
| Change pills | Changes such as +3.2%, −1.5 pts or −17% appear as small pills. The sign is always written, so colour is never the only clue. |
| Share bars | A column called Share, % of total or Part gets a small bar next to each percentage. |
| Sort | Select a column title: numbers largest first, text from A to Z. Select it again to reverse, and a third time (or Original order) to go back. The total row stays at the bottom. |
| CSV | Downloads the table as a CSV file, with numbers unformatted so spreadsheets read them correctly. |
| Copy | Copies the table as tab-separated text, ready to paste into Google Sheets or Excel. |
| Show all / Show less | Long tables show the first 8 rows. Unfold the rest, or fold them again. |
A pill is green or red only in a change column (for example Change, Δ, vs last week, Evolution) of a metric where more is better. For metrics where less is better, such as bounce rate, exit rate, cost or load time, and in other columns, it stays grey.
When Henkan writes where the numbers come from (a line starting with Source: or Period:), it appears as a small grey line under the table. On a phone, a wide table scrolls sideways inside its frame.
Charts#
When a trend or a comparison of five or more items is easier to see than to read, Henkan adds a line, bar or stacked bar chart. It always comes with a table or the key numbers, and Henkan does not draw one when fewer than 3 points have data.
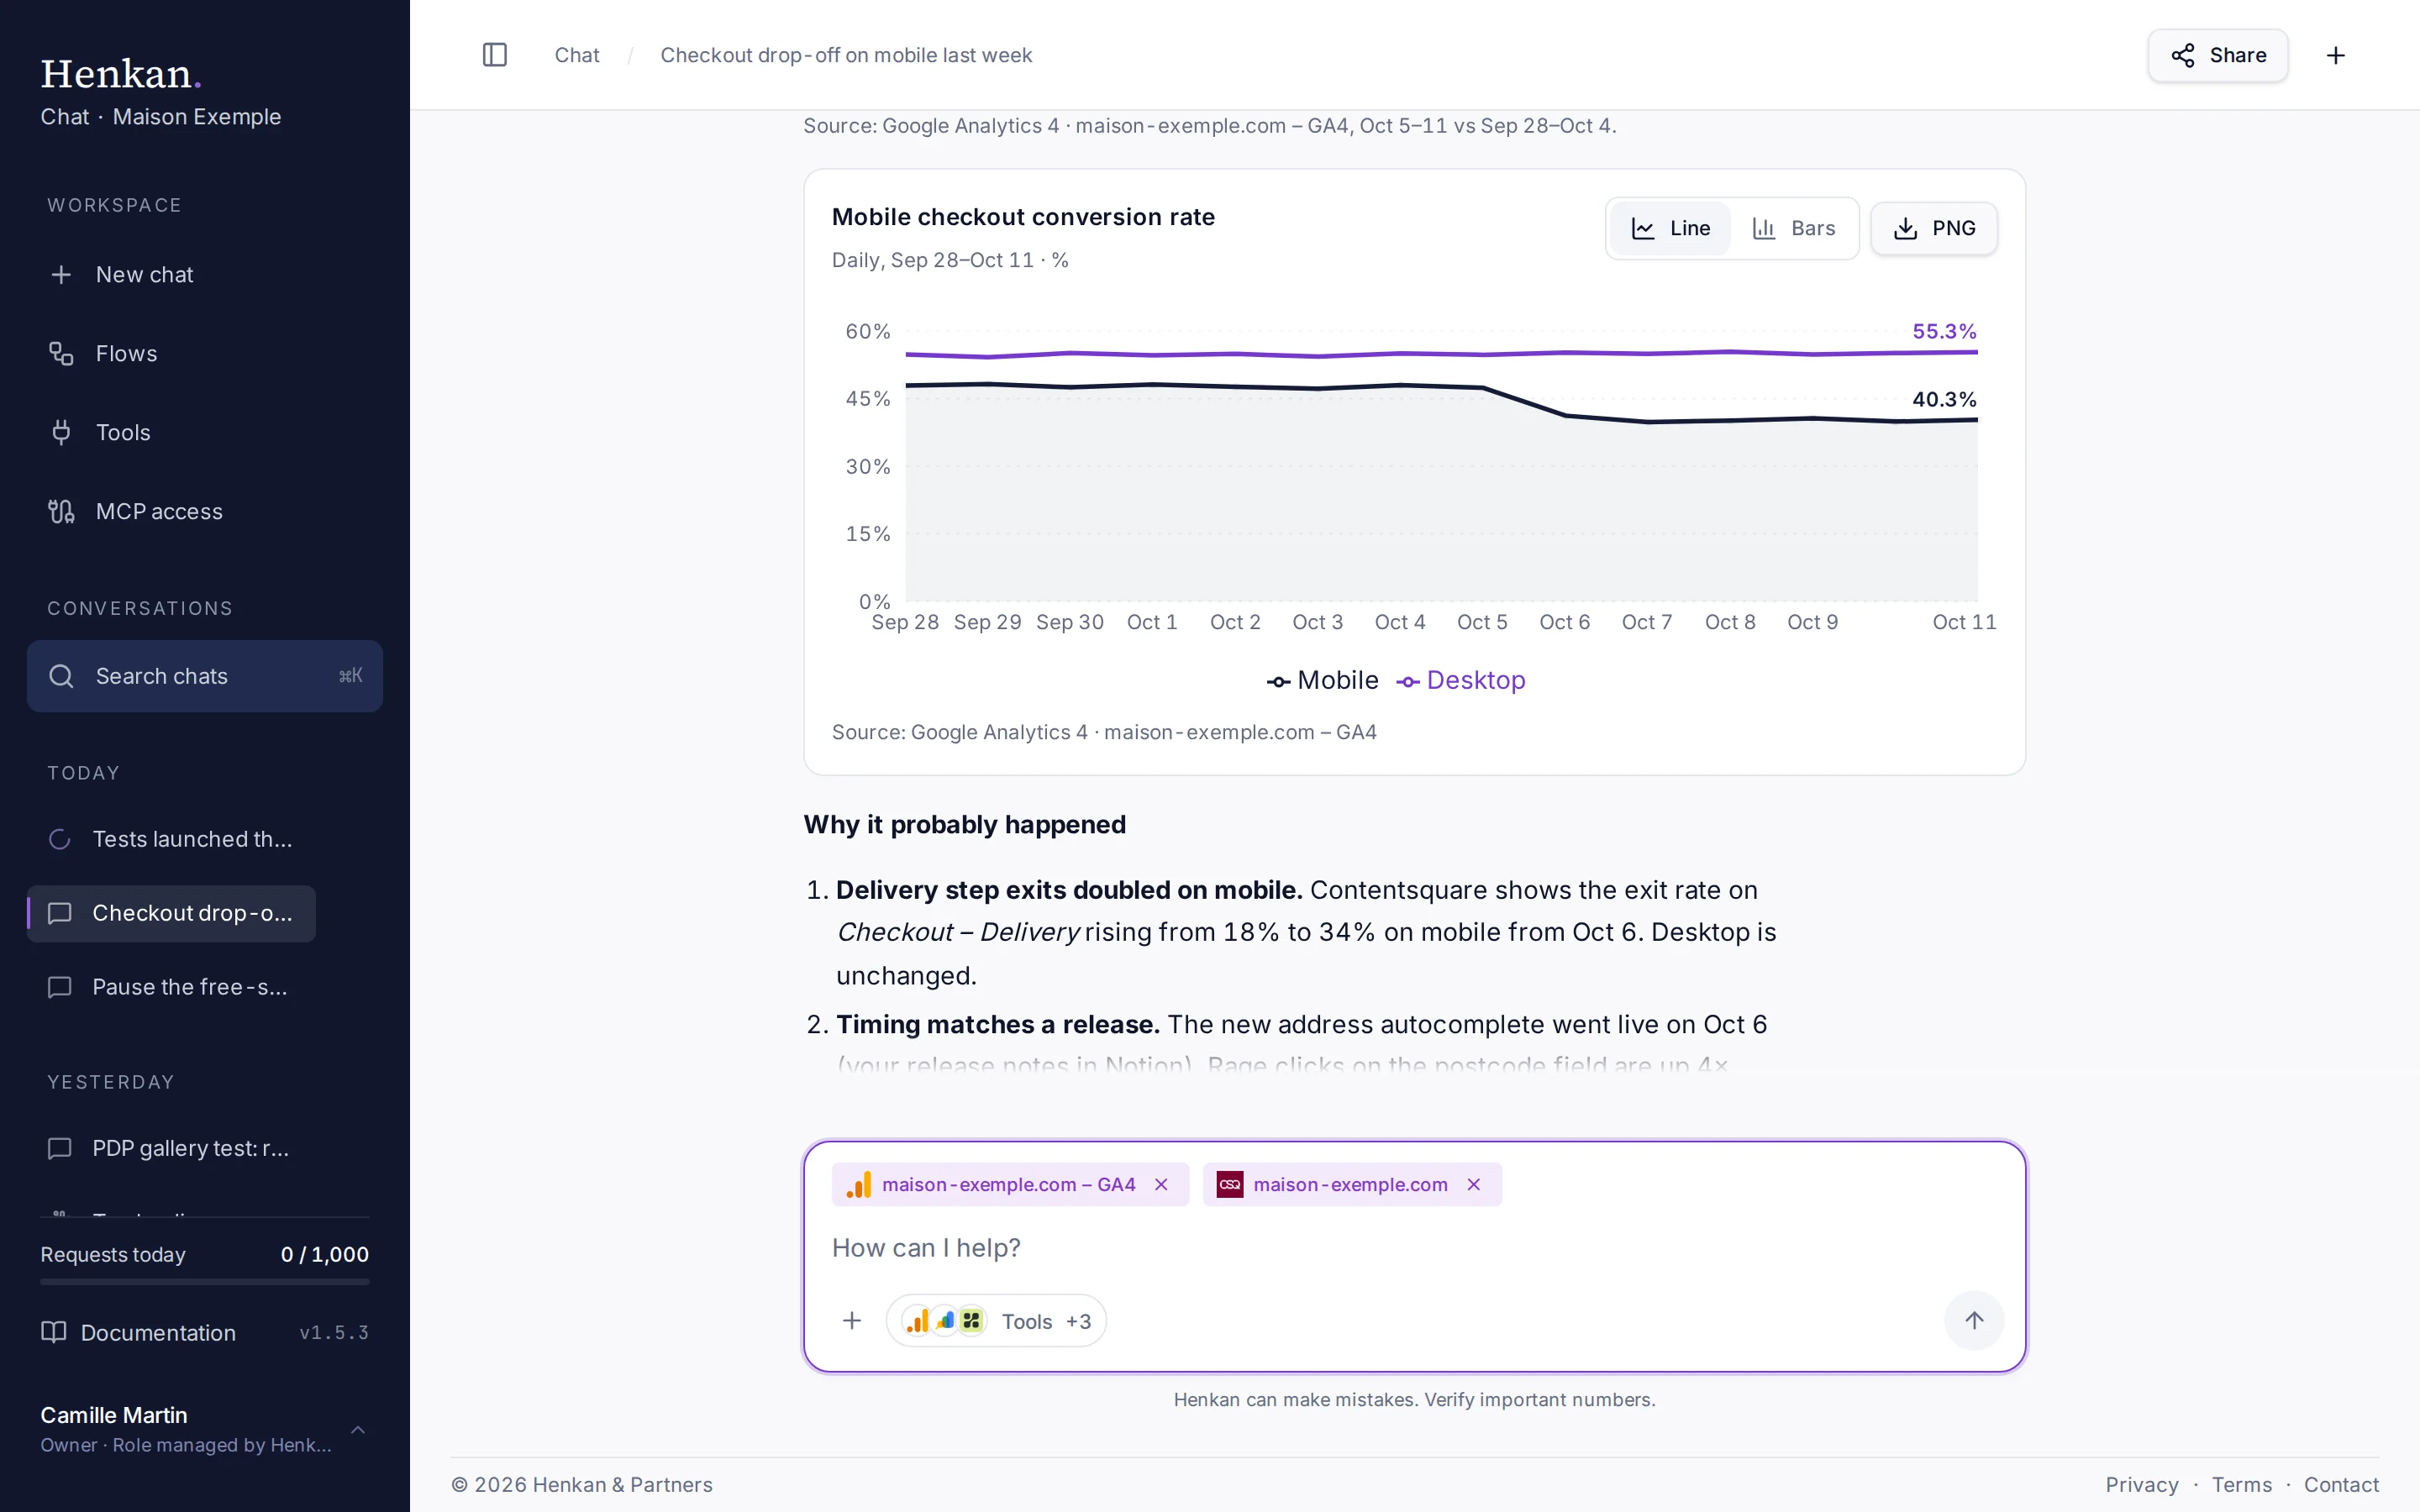
- Line / Bars switches a line chart to bars and back. Stacked bars stay as they are.
- PNG downloads the chart as an image, ready for a slide or an email.
- The last value of each series is written at the end of the line (or on top of the last bar).
- The source line under the chart only appears when Henkan knows where the numbers come from. It is never guessed.
Sources and actions#
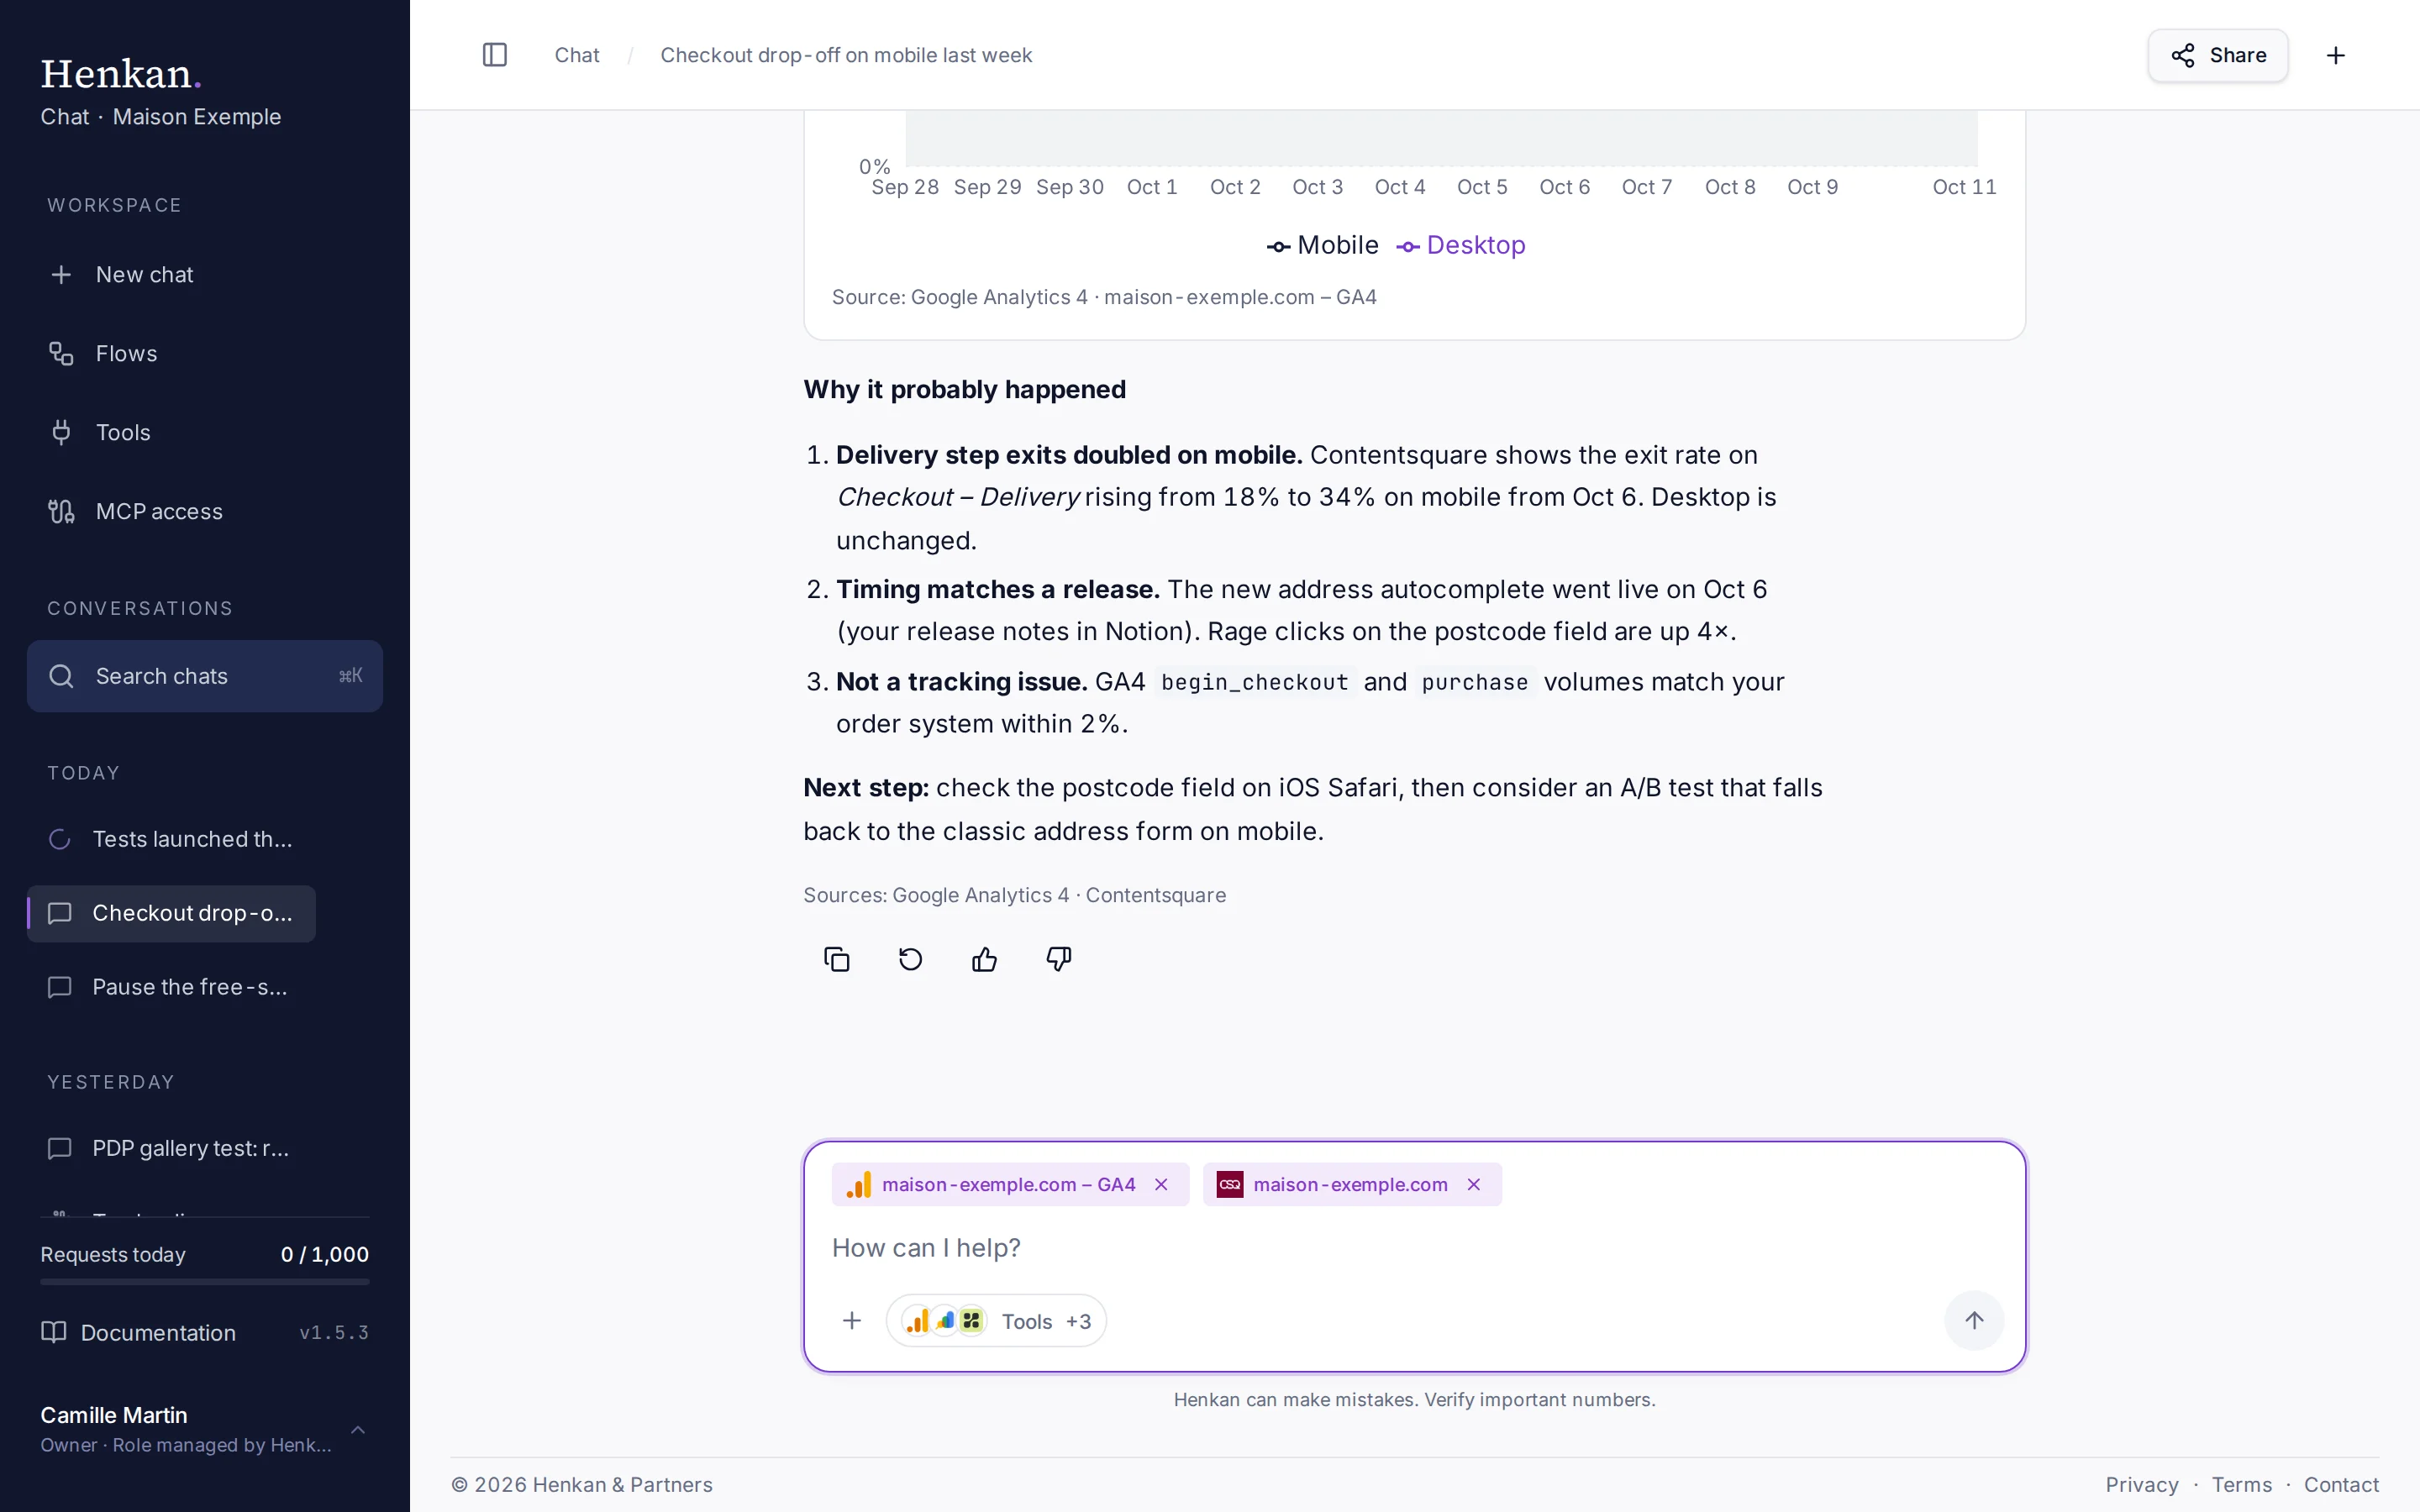
| Action | What it does |
|---|---|
| Copy | Copies the text of the answer as Markdown. |
| Regenerate | Deletes the last answer and writes a new one. Only on the last answer. |
| Helpful / Not helpful | Marks the answer for your own reference. |
| Edit | On your last message: change it and select Save & resend to get a new answer. Attachments are kept. |
When an answer doesn't finish#
If an answer is cut off, for example after a network problem, it shows This answer was interrupted. or This answer didn't finish. Select Retry to ask the same question again.
How Henkan handles numbers#
- It says which tool each number came from, and mentions the property's time zone and currency for Google Analytics.
- It flags sampling, privacy thresholds and "(other)" grouping when GA4 reports them.
- For A/B tests it reports uplift, 95% confidence interval, p-value and a sample ratio mismatch check, and never calls a winner unless the result is significant at 95%.
- For survey data it states the sample size and margin, and labels open-text themes as AI-generated.